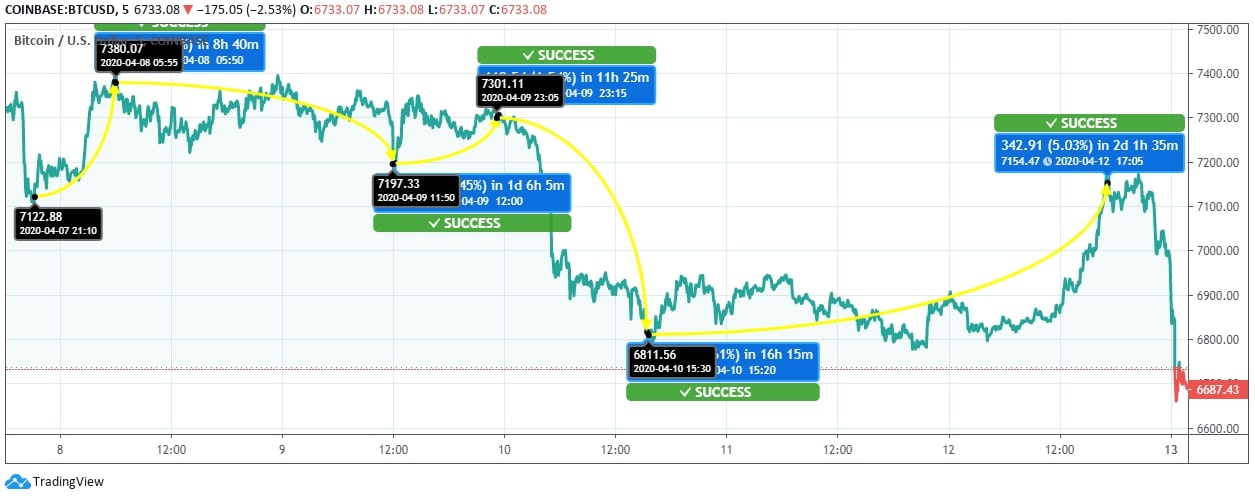
Bitcoin (BTC) price has been leading the change in the crypto market since the start of the year through the volatility has stalled its journey at intermittent intervals. This has, however, not deterred the pride of BTC from pushing in the upper range over the past seven days though there has been continual bear pressure, with the price seen fluctuating in the range between $6812 – $7380.
BTC/USD Price Chart
Over the last 7 days, Bitcoin faced huge volatility and trade mostly under continual bear pressure. The price was at $7122.88 on April 07. On the next day, the price of BTC took on an upward rally to $7380.07, showing a rise of 3.6%. Then, the currency managed to trade stably with moderate fluctuations. On April 09, the price fell to $7197.33 by 2.45% decline, but it managed to recover on the same day to $73011.11 by registering an upward swing of 1.54%.
Further, the bears once again exerted pressure on the price of Bitcoin, and hence, it fell to $6811.56, showing a downward correction of 6.61%. From this low, the BTC price took an upward rally to the extent of 5.03% on April 12 and reached $7154.47. However, the coin again faced rejection and fell to a low of $6687.43 at the time of writing.
Bitcoin price has managed to trade above its crucial support $6500 even under the strong bearish influence. Hence, analysts are confident in the ability of the coin to get back to its upward momentum in the ensuing weeks.


