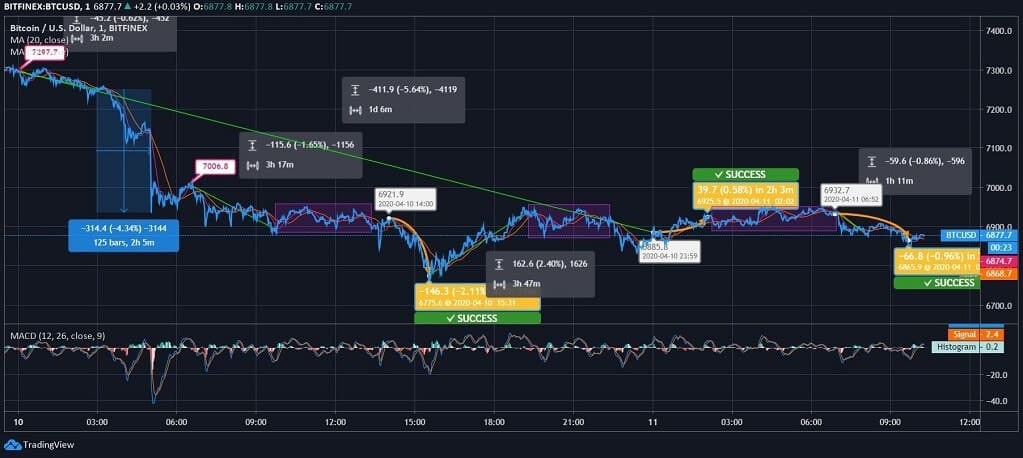
Bitcoin was spotted downward momentum on yesterday’s chart, but today, the price is spotted holding the level tightly around $6,800. However, the bulls are likely to lose the follow-through. The coin is marking a steady drop in the price chart. The intraday movement of the BTC is likely to be adventurous. The closing might carry marginal loss in the price.
BTC/USD Price Chart:
From the past three days, Bitcoin was trading under moderate bearish pressure. Yesterday, the price spotted at $7,297 during the initial hour. The price started dribbling from the first hour, and at 03:00 UTC, the BTC price was at $7,254. After the same, the currency continued to trade downwards and fell to $6,937. With a spike at $7,006, Bitcoin price again fell and reached $6,887 by 1.65% fall. Then, the coin locked its price around the same level till 13:16 UTC, but in the later hours, the coin dropped to $6,775.
Further, BTC registered slight improvement, and the price touched $6,970 at 19:19 UTC, but before closing the day, the price plunged to $6,885. The day-long movement in Bitcoin reflected 5.64% regression. Today, the currency started the day with a slight improvement. The price counters moved from $6,885 to $6,925, and then, it hovered at the same level till 06:52 UTC. Later, the BTC price dropped to $6,865. The current price of Bitcoin is near to its immediate support level at $6,677. The same might get violated in the upcoming hours.


